I thought it was time to create another overview of the features my extension provides. Basically, wherever you find a magic wand hover or click to learn more about that feature. Most features popup additional info.
In this blog, click the images to see them larger.

On a listing detail page you will notice two new sections of links.
- Hide: prevents the listing from showing up on search results
- Watch: add this borrower to my extension's favorite list. Watching a borrower allows for relists to show up on your favorites list
- Alert: if you use gmail you can easily receive email alerts as the listing approaches its ending time
- Notes: you can save notes about the borrower (not the listing) again great for relists or borrowers coming back for a 2nd loan
The Market Analysis is my favorite addition. These links all make use of Prosper's Marketplace performance page. I just plug in the relevant information to limit the search to similar loans. Typically I just click the magic wand on these to see the popup. If you want to see the full page, click on the broad, narrow, specific link to open a new window to Prosper's Marketplace performance page. Here is an example after clicking the Broad magic wand.
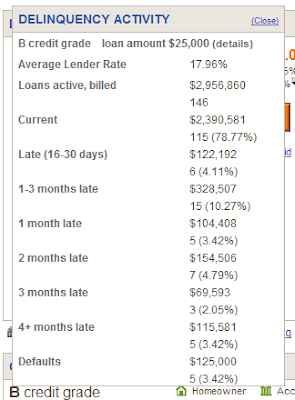
So much useful info here. First hover of (details) and it will tell you what criteria is used for this info. Very useful when you click on the Specific magic wand. This average interest rate is more reliable than the one Prosper gives, which is based on huge buckets. Mine is more relevant to the listing you are examining. On this popup I examine the percent of loans that are current. In this example it is 78.77%, that gives a 21.23% chance of defaulting. Historically 85% of loans that go 1 month late default. So I count any loan that is late at any point as defaulted.
I examine the broad and specific market analysis the most. I strive to only bid on listings that have a specific chance of defaulting less than 10%. Not shown, but this particular listing had a specific 19% chance of defaulting.
After examining the chance of defaulting, I will then click on Similar Loans. This opens a new window that shows all the loans that are defaulting that are similar to this listing. This gives you the opportunity, if you wish, to examine every loan to try and determine why it defaulted... and determine if your listing is like those and therefore has an increased chance of defaulting. Depending on the number of loans that are similar this page can take awhile to load... so often I will click it first then go back to the original listing and perform analysis, then go check the similar page.
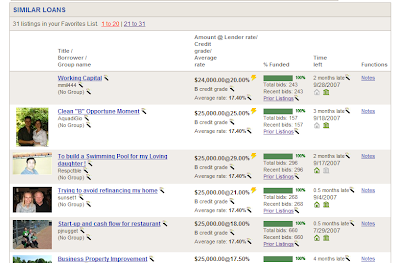
The loans are displayed in descending origination date... most recent first. See all those magic wands... click on them... do not click on the listing link as this will open the listing in the browser, and the similar loans will have to be reloaded. I'll try and automatically open the listing in a new window. Back to the magic wands... they will display the listing description, the credit info, the borrower description... all in nice popups. For the credit info you have to provide your login information... don't worry I do not keep it. This is required to access the data through Prosper's API.
If you do this enough you will often see the lightning bolts... as I have said before... the lightning bolt increased your chance of getting burned... stay away from them.
Now start clicking on the magic wand next to the loan's credit info. You will quickly start to see trends.... does your listing match these? If so stay away.
There is just so much information in this page hopefully you will take the time to study and learn.
At the very top of the page is a link in big capital letters... VIEW ADDITIONAL INFO. Click it and you get something like this in a new window:
Loan Origination
Year.Month : Total : Late Loans
2006.04 : 2 : 1 : 50.00%
2006.05 : 2 : 2 : 100.00%
2006.07 : 1 : 0
2006.08 : 4 : 1 : 25.00%
2006.10 : 1 : 0
2006.11 : 4 : 1 : 25.00%
2006.12 : 4 : 0
2007.01 : 15 : 3 : 20.00%
2007.02 : 7 : 4 : 57.14%
2007.03 : 8 : 2 : 25.00%
2007.04 : 20 : 9 : 45.00%
2007.05 : 8 : 2 : 25.00%
2007.06 : 16 : 1 : 6.25%
2007.07 : 6 : 0
2007.08 : 8 : 1 : 12.50%
2007.09 : 14 : 3 : 21.43%
2007.10 : 7 : 1 : 14.29%
2007.11 : 19 : 0
2007.12 : 8 : 0
2008.01 : 11 : 0
Thru 2006.6 :4 : 3 : 75.00%
Thru 2006.12:12 : 5 : 41.67%
Thru 2007.6 :86 : 26 : 30.23%
Thru 2007.12:115 : 31 : 26.96%
Total :165 : 31 : 18.79%
Number of similar loans created in the past month: 7
Dates of significant change: Aug-2006 and Feb-2007
Additional credit info was added on these dates
Again you can learn a lot about this data. In this case not a lot of similar loans are created each month. You can see that the trend for the defaulting rate is rising. As you hopefully already know, as loans age the default rate increases. This page attempts to show you how drastic this trend is.
I have also added some quick links to useful information to the borrower info section on the listing detail page.
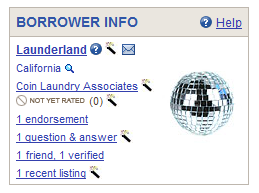
These next few features are vital to my analysis of the listing... sorry I have not uploaded images of these.
The wand next to the group name will popup a detailed list of this group's default success or failure... number of loans, etc. Click the wand next to the Q&As and you will see all of them, rather than just the first few. Click the wand next to the recent listings and you will see all of the listings... not just recent. Right click in the popup to view the prior listings... you can learn a lot by doing this!
In the Endorsements section I add a link called Verify Bids which will determine if the endorser's bid still stands. Typically GLs bid at the highest rate, get bid off... some even practice pump and dump... bid large, large amounts to attract attention.


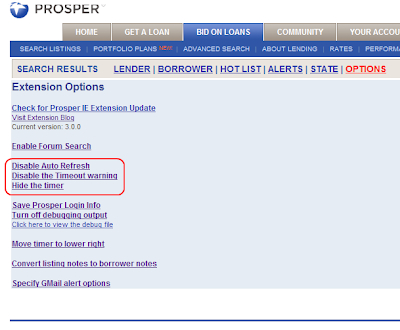
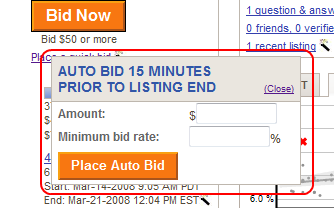
 Which pops up this autobid dialog:


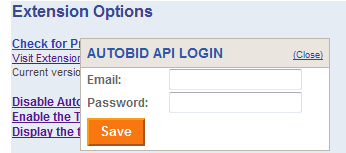
 In order to use this feature you will have to login to the Prosper API. This login is separate from being logged into the website. Again I don't care about your email address or password. But if you want to use this feature you have to enter the values in a popup. It looks like this:
 So click the place a quick bid link and you will be presented with this just once per session. Once successful, click the place a quick bid link again. Please note you cannot hit the enter key to sign in, you must click the button. You will then see this:


